INVESTMENTS · CALCULATOR 03
SIP Real Return & Wealth Multiplier
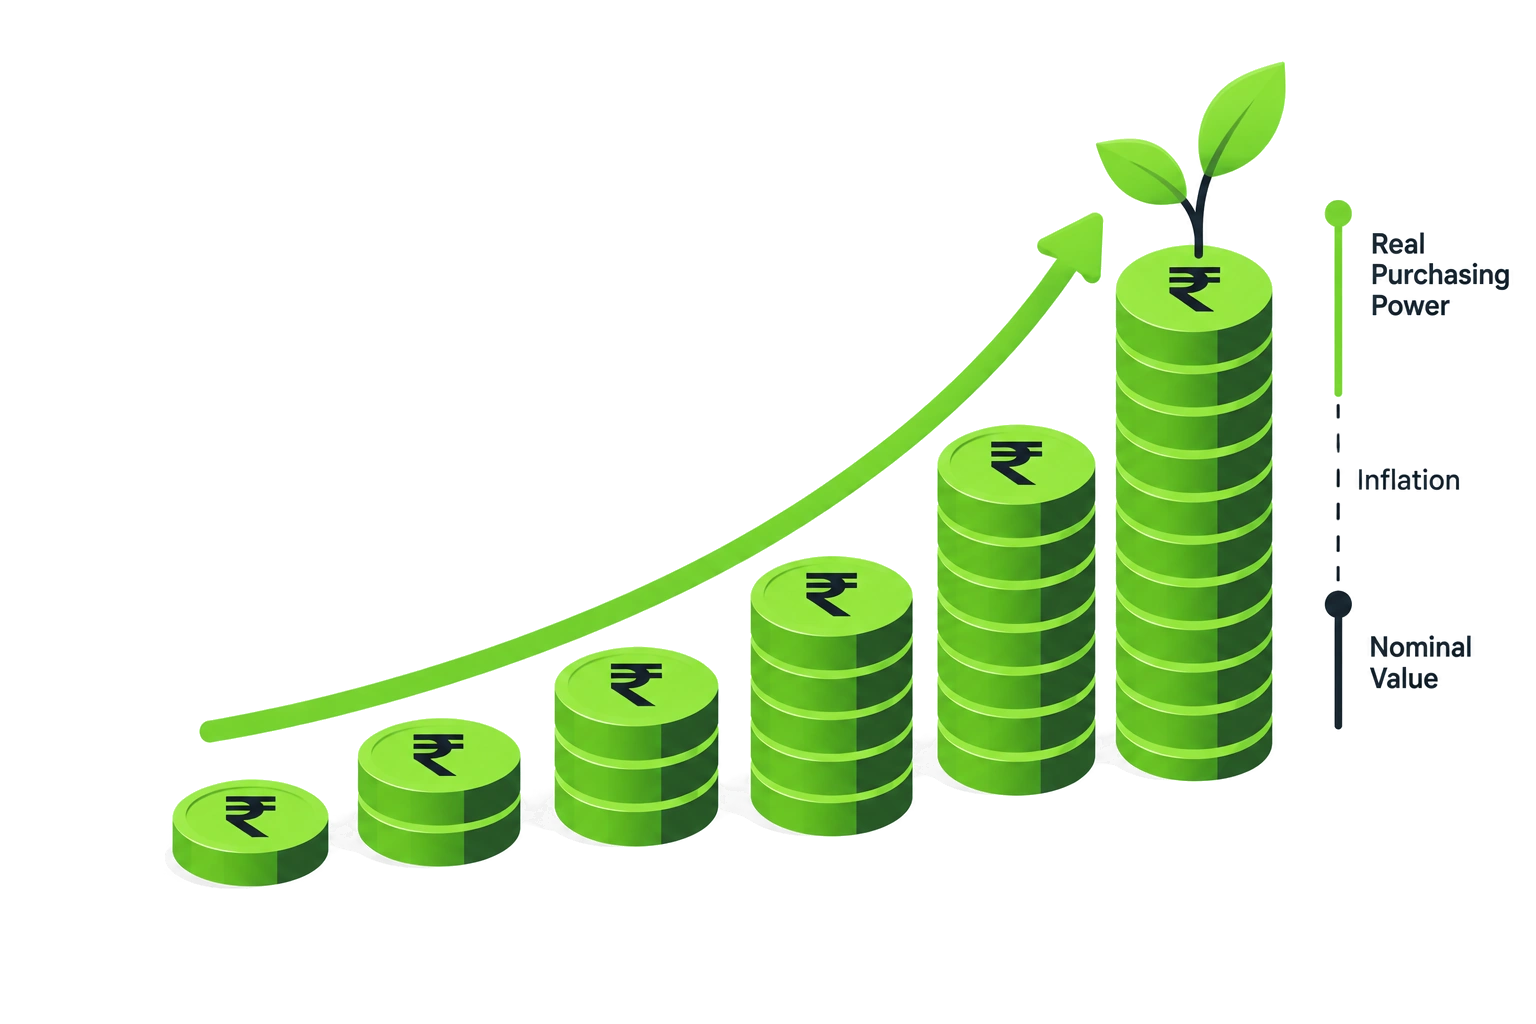
Mutual fund calculators show astronomical future numbers, ignoring that ₹1 Crore in 20 years will buy what ₹30 Lakh buys today. This calculator strips away inflation and the 12.5% LTCG tax to reveal your true future purchasing power.
1. Investment Inputs
₹20,000/mo
₹1,000₹1,00,000₹2,00,000
15 Years
1 Year15 Years35 Years
10% /yr
0% (Fixed SIP)10% (Salary Hike)25%
2. Inflation & Tax Factors
12% p.a.
6% (Conservative)12% (Nifty Index)20% (Aggressive)
6% p.a.
3%6% (RBI Target Avg)10%
Total Invested
₹76.25 Lakh
Nominal Future Corpus
₹173.68 Lakh
Today's Purchasing Power
₹67.45 Lakh
REAL WEALTH VERDICT
After 12.5% LTCG tax and 6% inflation, your real annual purchasing power growth is
5.6% Real
equity (5.6% real)bank FD (0.9% real)
Your nominal 12% CAGR delivers 5.6% in true inflation-adjusted purchasing power after 12.5% LTCG tax — outpacing bank FDs (0.9% real) by 1.5×.
Wealth Creation Reality Check
Compounding with a 10% annual step-up delivers a 2.3× wealth multiplier on your total capital invested.
Gross Capital Gains:₹97,42,303
Estimated LTCG Tax (12.5%):-₹12,02,163
Net Take-Home Wealth:₹1,61,65,536
Year-by-Year Wealth Progression
Tracking nominal capital growth vs inflation-adjusted purchasing power.
| Year | Monthly SIP | Total Invested | Nominal Corpus | Real Purchasing Power | Unrealized Gains |
|---|---|---|---|---|---|
| Year 1 | ₹20,000 | ₹2,40,000 | ₹2,56,187 | ₹2,41,685 | +₹16,187 |
| Year 2 | ₹22,000 | ₹5,04,000 | ₹5,70,483 | ₹5,07,728 | +₹66,483 |
| Year 3 | ₹24,200 | ₹7,94,400 | ₹9,52,820 | ₹8,00,006 | +₹1,58,420 |
| Year 4 | ₹26,620 | ₹11,13,840 | ₹14,14,646 | ₹11,20,532 | +₹3,00,806 |
| Year 5 | ₹29,282 | ₹14,65,224 | ₹19,69,141 | ₹14,71,457 | +₹5,03,917 |
| Year 6 | ₹32,210 | ₹18,51,746 | ₹26,31,468 | ₹18,55,081 | +₹7,79,722 |
| Year 7 | ₹35,431 | ₹22,76,921 | ₹34,19,054 | ₹22,73,866 | +₹11,42,133 |
| Year 8 | ₹38,974 | ₹27,44,613 | ₹43,51,911 | ₹27,30,443 | +₹16,07,298 |
| Year 9 | ₹42,872 | ₹32,59,074 | ₹54,53,001 | ₹32,27,623 | +₹21,93,927 |
| Year 10 | ₹47,159 | ₹38,24,982 | ₹67,48,653 | ₹37,68,412 | +₹29,23,671 |
| Year 11 | ₹51,875 | ₹44,47,480 | ₹82,69,033 | ₹43,56,023 | +₹38,21,552 |
| Year 12 | ₹57,062 | ₹51,32,228 | ₹1,00,48,683 | ₹49,93,888 | +₹49,16,455 |
| Year 13 | ₹62,769 | ₹58,85,451 | ₹1,21,27,131 | ₹56,85,672 | +₹62,41,680 |
| Year 14 | ₹69,045 | ₹67,13,996 | ₹1,45,49,580 | ₹64,35,293 | +₹78,35,584 |
| Year 15 | ₹75,950 | ₹76,25,396 | ₹1,73,67,699 | ₹72,46,934 | +₹97,42,303 |